Dive into the details of the latest engineering salary survey
Respondents to the 2022 salary study were paid better and mostly satisfied with their jobs
Engineering salary survey insights:
- The average engineering professional is 50 years old, plans to retire in 2040, and worked on approximately 36 total projects last year.
- Average base salary among engineering professionals has increased 15.4% since 2014, the first year in which Consulting-Specifying Engineer conducted research on compensation, from $99,100 to $114,400. Average nonsalary compensation has also increased by 2.5% since 2014.
- The average number of hours worked per week increased from 44 to 58 between 2021 and 2022 survey data. Hours billed have also increased from 36 to 41 per week.
The ninth annual Consulting-Specifying Engineer salary survey of mechanical, electrical, plumbing, fire protection and lighting engineers shows that the average base annual salary in 2022 was $114,434, a slight increase over $112,624. Average nonsalary compensation was $13,037, nearly even with data reported in 2021.
The average base salary among engineering professionals has increased 15.4% between 2014 and 2022, according to the annual report. Average salaries rose from $99,100 in 2014 to $114,400 in 2022. Average nonsalary compensation has also increased by 2.5% since 2014.
The average 2022 salary among survey respondents was an increase of 1.6% over 2021 data. More than half (58%) of this year’s respondents received a salary of more than $100,000. Eight out of 10 (80%) of respondents reported their total compensation increased from 2021 to 2022: 31% said the increase was up to 4%, 28% said 5%-9%, and 21% said 10% or more. A small amount (15%) reported no change in compensation.
Half (50%) of all respondents said they worked at a consulting engineering firm, 16% work for an architectural engineering firm and 15% indicated they were either an in-house engineer for government agency, public utility company or industrial/commercial institutional firm. Only 12% indicated they worked for a design/build, construction/contracting firm. These numbers are based on the anonymous responses of professionals from a variety of engineering disciplines and at different levels in their professional career.
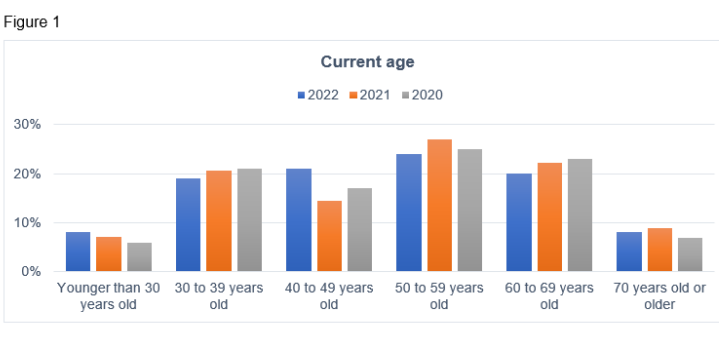
From the 2022 study results, 25% are 60 or older, 24% are 50-59 years old, 21% are 40-49 years old and 19% are 30-39 years old. Only 8% are under 30 years old.
Younger staff, defined by the U.S. Department of Labor as 40 or younger, equate to 27% — about the same as last year’s survey respondents, which reported 29% in this age group. See Figure 1 for the comparison of age groups over the past several years.
Challenges this year included:
-
Not enough junior team members to prepare for the future: 49%.
-
Not enough people working on a project: 42%.
-
Poor communication between consultants, architect, etc.: 40%.
-
Lack of bonuses: 24%.
-
Lack of training: 24%.
Total compensation went up slightly in 2022 in both base salary and nonsalary compensation.
Nonsalary compensation was awarded for two primary reasons:
-
Company profitability: 48%.
-
Personal performance or promotion: 41%.
When comparing compensation, the numbers changed again this year. Electrical/power system designers made the most, earning $147,182, an increase from $125,167. Mechanical engineers came in next, earning $123,477, a decrease from $129,829 in 2021. Those who specify fire protection/life safety systems made an average of $102,500, a decrease from $122,572 in 2021.
See the compensation tables for a more detailed breakdown. Download the full report here.

Table 1: Overall compensation for specifying engineers. Courtesy: CFE Media and Technology

Table 2: Salaries for electrical and power engineers. Courtesy: CFE Media and Technology

Table 3: Salaries for fire protection/life safety engineers. Courtesy: CFE Media and Technology

Table 4: Salaries for lighting design engineers. Courtesy: CFE Media and Technology
Changing employers
According to the survey, 12% of respondents are looking to change jobs in the next year and 24% aren’t sure, meaning about one-third of employees could be looking for a new position. A consistent two-thirds of respondents are not looking for a new job.
As seen in past studies, many respondents are either very satisfied (24%, a dramatic drop from 34%) or satisfied (50%, a drop from 44%) with their jobs, equal to 74% of respondents satisfied. Only 8% are dissatisfied, and the remainder remain neutral.
Survey methodology
A survey was emailed to Consulting-Specifying Engineer audience members and information was collected in October 2023. A total of 329 qualified responses were returned, with a margin of error of +/-5.4% at a 95% confidence level. Participants frequently had the option to select more than one response, thus totals do not always equal 100%.

Figure 1: The age of survey respondents continues to remain on the older side; most respondents are older than 40. The average age of this year’s respondents is 50, a slight drop from last year’s 51 years old. Courtesy: Consulting-Specifying Engineer

Figure 2: The average compensation by job function was highest for engineering management, different from senior administration earning the most in the previous reporting period. Most respondents to this study were engineers. Courtesy: Consulting-Specifying Engineer

Figure 3: The majority (43%) of respondents earned $100,001 to $150,000. The next largest group (37%) earned $50,001 to $100,000. Courtesy: Consulting-Specifying Engineer
Do you have experience and expertise with the topics mentioned in this content? You should consider contributing to our CFE Media editorial team and getting the recognition you and your company deserve. Click here to start this process.